
A Comprehensive Analysis of Market Trends, Drivers, and Future Projections
Introduction: The Growth Story Behind the Numbers
The golf cart battery market is experiencing a remarkable transformation. While headlines citing “59% growth” capture attention, the reality is more nuanced—and equally impressive. The global golf cart battery market is projected to grow from $140.91 million in 2025 to $259.42 million by 2032, representing a compound annual growth rate (CAGR) of 9.11% -2-5.
This growth trajectory reflects a fundamental shift in how golf carts are powered and used. From traditional lead-acid batteries to advanced lithium-ion systems, the market is evolving rapidly. But what’s driving this surge? Who benefits? And what does the future hold?
In this comprehensive analysis, we’ll explore:
-
Verified market size and growth figures from leading research firms
-
Key drivers fueling market expansion
-
Regional dynamics and market share analysis
-
The accelerating shift from lead-acid to lithium
-
Challenges and opportunities for industry players
-
Future outlook through 2032
Part 1: The Numbers Behind 59% Growth
1.1 Understanding the Market Size
Several research firms track the golf cart battery market, each with slightly different methodologies and scopes. Here’s a consolidated view:
| Research Firm | Base Year Value | Forecast Year | Forecast Value | CAGR | Scope |
|---|---|---|---|---|---|
| 360iResearch | $140.91M (2025) | $259.42M (2032) | 9.11% | Total market -2 | |
| QYResearch | $1620M (2025) | $2342M (2032) | 5.6% | Lithium segment only -3 | |
| Allied Market Research | $122.8M (2021) | $216.5M (2031) | 5.9% | Total market -7 |
Important Distinction: The wide variance in figures reflects whether reports measure the total golf cart battery market (including lead-acid) or the lithium segment only. The 9.11% CAGR cited by 360iResearch represents the total market, while higher growth rates apply specifically to lithium adoption -2-5.
1.2 Lithium Segment Growth
The lithium-ion segment is growing significantly faster than the overall market:
-
2025 lithium market size: $1.62 billion (approximately 1.16 million units at $1,350 average price) -3
-
2032 projected lithium market: $2.342 billion -3
Lithium batteries already account for 62.2% of the market share as of 2021, and this dominance continues to grow -7.
Part 2: Key Drivers of Market Growth
2.1 Accelerating Shift from Lead-Acid to Lithium
The primary driver of market growth is the ongoing replacement of traditional lead-acid batteries with lithium alternatives. This shift is driven by lithium’s compelling advantages:
| Feature | Lead-Acid Battery | Lithium Battery (LiFePO₄) |
|---|---|---|
| Cycle Life | 300–500 cycles | 2,000–5,000 cycles -6 |
| Charging Time | 8–12 hours | 2–4 hours -6 |
| Weight | Heavy (250–350 lbs for 48V) | Lightweight (60–100 lbs) -6 |
| Maintenance | High (watering, cleaning) | None -6 |
| Usable Capacity | 50% | 80–90% |
| Power Stability | Declines during discharge | Consistent throughout |
The Economic Case: Lithium batteries offer lower total cost of ownership despite higher upfront prices. For fleet operators, the combination of longer life, faster charging, and zero maintenance delivers compelling ROI within 2–4 years -3-6.
2.2 Electric Vehicle Adoption and Electrification Trends
The broader electrification movement extends to golf carts and low-speed vehicles:
-
Golf courses are modernizing fleets for improved efficiency and reduced maintenance
-
Resorts and hotels increasingly use electric carts for guest transportation
-
Retirement communities and gated neighborhoods rely on golf carts as primary neighborhood vehicles
-
Commercial campuses and industrial facilities use electric carts for internal logistics
Government initiatives promoting EV adoption and investments in battery manufacturing infrastructure further accelerate this trend -7.
2.3 Tourism and Hospitality Growth
The global tourism industry’s expansion directly fuels golf cart battery demand:
-
New hotel and resort developments increasingly incorporate golf carts for guest mobility
-
Golf course construction, particularly in emerging markets, drives OEM demand
-
Existing facilities upgrade fleets to enhance guest experience and reduce operating costs
The hospitality sector’s focus on sustainability and quiet operation favors lithium-powered carts -7.
2.4 Urbanization and Rising Living Standards
Rapid urban development and increasing disposable incomes encourage golf cart adoption in:
-
Planned communities where carts serve as primary neighborhood vehicles
-
Retirement villages where residents rely on carts for daily mobility
-
Resort properties where carts provide convenient transportation
This trend is particularly strong in North America and emerging Asian markets -7.
2.5 Falling Lithium Battery Prices
Lithium battery system costs continue to decline due to:
-
Manufacturing scale economies
-
Improved cell chemistry and production efficiency
-
Intensifying competition among producers
-
Supply chain maturation
Lower prices make lithium upgrades accessible to more cart owners, accelerating the replacement cycle -3-6.
2.6 Technological Advancements
Improved battery technology expands addressable markets:
-
Better Battery Management Systems (BMS): Enhanced safety, monitoring, and cell balancing
-
Higher energy density: More range in same physical footprint
-
Fast-charging capability: 1–2 hour full charges becoming possible
-
Cold-weather performance: Self-heating batteries address charging restrictions
-
Integration features: Bluetooth monitoring, app connectivity
These advances make lithium suitable for applications previously dominated by lead-acid -6.
Part 3: Market Segmentation Insights
3.1 By Battery Type
| Segment | Market Share (2021) | Growth Outlook |
|---|---|---|
| Lithium-Ion | 62.2% | Fastest growth, increasing share -7 |
| Lead-Acid | 37.8% | Stable but declining |
Lithium’s dominance reflects its advantages in efficiency, durability, and suitability for modern golf carts. Lead-acid retains a presence in budget-conscious segments -7.
3.2 By Voltage
| Voltage | Typical Application | Market Position |
|---|---|---|
| 6V | Standard golf carts | 40.8% share, 6.3% projected CAGR -7 |
| 8V | 48V systems | Growing with lithium adoption |
| 12V | 48V systems, accessories | Stable |
| 36V/48V/72V | Various cart types | Lithium systems concentrated here |
3.3 By Application
| Application | Growth Rate | Drivers |
|---|---|---|
| Golf Courses | 6.5% CAGR | Fleet upgrades, new course development -7 |
| Resorts & Hospitality | Strong | Guest experience, sustainability focus |
| Residential Communities | Growing | Neighborhood vehicle adoption |
| Commercial/Industrial | Emerging | Campus logistics, facility operations |
3.4 By Distribution Channel
| Channel | Description | Trends |
|---|---|---|
| OEM | New cart manufacturers | Integrating lithium options |
| Aftermarket | Replacement/upgrade market | Fastest growth, DIY installations |
| Online | Direct-to-consumer sales | Increasing convenience, competitive pricing |
Part 4: Regional Market Analysis
4.1 North America
| Metric | Value |
|---|---|
| Market Share (2025) | ~40% -6 |
| Projected Share (2032) | 38% -6 |
| Growth Drivers | Mature golf cart ecosystem, high consumer base, R&D investment |
North America remains the largest market due to:
-
High penetration of golf carts in residential communities
-
Well-established aftermarket networks
-
Strong consumer awareness of lithium benefits
4.2 Asia-Pacific
| Metric | Value |
|---|---|
| Market Share (2025) | 25% -6 |
| Projected Share (2032) | 30% -6 |
| Growth Drivers | Rapid adoption, manufacturing concentration |
Asia-Pacific is the fastest-growing region, driven by:
-
Increasing golf course development in China, India, Southeast Asia
-
Rising disposable incomes and tourism
-
Concentration of battery manufacturing capacity
4.3 Europe
| Metric | Value |
|---|---|
| Market Share (2025) | 20% -6 |
| Projected Share (2032) | 18% -6 |
| Growth Drivers | Sustainability focus, mature markets |
European growth reflects:
-
Strong environmental regulations favoring lithium
-
Established golf and resort infrastructure
-
Emphasis on recycling and circular economy
4.4 Middle East & Africa
| Metric | Value |
|---|---|
| Market Share (2025) | 10% -6 |
| Projected Share (2032) | 8% -6 |
| Growth Drivers | Luxury resort development, emerging markets |
4.5 Latin America
| Metric | Value |
|---|---|
| Market Share (2025) | 5% -6 |
| Projected Share (2032) | 6% -6 |
| Growth Drivers | Growing tourism, resort expansion |
Part 5: The Lithium Advantage Deep Dive
5.1 Performance Metrics That Drive Adoption
Cycle Life Comparison:
-
Lead-acid: 300–500 cycles (1–2 years of daily use)
-
Lithium: 2,000–5,000+ cycles (5–15+ years of daily use)
Usable Capacity:
-
Lead-acid: 50% of rated capacity (must avoid deep discharge)
-
Lithium: 80–90% of rated capacity (safe deep discharge)
Weight Savings:
A 48V lithium system weighs 60–100 lbs versus 250–350 lbs for lead-acid—a reduction of 150–250 lbs that improves acceleration, hill climbing, and efficiency -6.
Charging Speed:
-
Lead-acid: 8–12 hours for full charge
-
Lithium: 2–4 hours for full charge, with opportunity charging capability -6
5.2 Total Cost of Ownership Advantage
| Cost Factor | Lead-Acid (10 Years) | Lithium (10 Years) |
|---|---|---|
| Initial purchase | $800–$1,500 | $2,500–$4,500 |
| Battery replacements | 2–3 sets ($1,600–$4,500) | 0 |
| Maintenance | $600–$1,200 | $0–$200 |
| Total 10-Year Cost | $3,000–$7,200 | $2,700–$4,700 |
Lithium achieves break-even within 2–4 years for regular users, then delivers savings thereafter -3-6.
Part 6: Challenges and Market Considerations
6.1 Upfront Cost Barrier
Despite compelling long-term economics, lithium’s higher initial price remains a barrier:
-
Entry-level lead-acid: $500–$800 for complete set
-
Quality lithium: $1,500–$4,500 for complete system
This gap limits adoption among budget-conscious consumers and infrequent users -3-7.
6.2 Cold-Weather Charging Limitations
Lithium batteries cannot be charged below 32°F (0°C) without built-in heating. This affects:
-
Northern climate users with unheated storage
-
Winter operation in cold regions
-
Seasonal storage requirements
Manufacturers address this through self-heating models and BMS protection, but it remains a consideration -6.
6.3 Supply Chain and Tariff Uncertainty
The 2025 U.S. tariff policy changes introduced significant complexity:
-
Increased duties on imported cells and components
-
Pressure to regionalize sourcing
-
Higher landed costs affecting pricing
6.4 Compatibility and Installation
-
Older carts may require charger port upgrades
-
12V accessories need DC-DC converters
-
Controller programming may optimize lithium performance
These factors add complexity to the upgrade process -6.
Part 7: Key Industry Players
The golf cart battery market features a mix of established lead-acid manufacturers and emerging lithium specialists:
Leading Manufacturers
| Company | Type | Market Position |
|---|---|---|
| Trojan Battery Company | Lead-acid + lithium | Premium brand, established reputation -1-3 |
| U.S. Battery Mfg. Co. | Lead-acid + lithium | Strong aftermarket presence -1-3 |
| East Penn Manufacturing | Lead-acid + lithium | Major manufacturer -1-3 |
| Exide Group | Lead-acid | Global presence -1-3 |
| BSLBATT | Lithium specialist | Growing market share -1-3 |
| Dakota Lithium | Lithium specialist | Consumer-focused -1-3 |
| RELION | Lithium specialist | Aftermarket focus -1-3 |
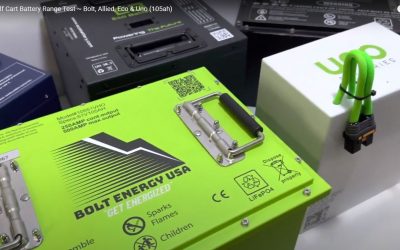
| Bolt Energy USA | Lithium specialist | North American presence -1-3 |
| 山东精工电子 | Lithium manufacturer | Chinese production base -1-3 |
| 深圳市鸿昊升电子 | Lithium manufacturer | OEM/ODM focus -1-3 |
| Redway Power | Lithium manufacturer | Global supplier -1-3 |
Competitive Dynamics
The market features tiered competition:
-
First tier: Established lead-acid brands expanding into lithium
-
Second tier: Lithium specialists with advanced technology
-
Third tier: Regional manufacturers and OEM suppliers
Industry consolidation through mergers and acquisitions continues as companies seek scale and technology access -1-8.
Part 8: Future Outlook Through 2032
8.1 Market Projections
| Metric | 2025 | 2032 | Change |
|---|---|---|---|
| Total market | $141M | $259M | +84% -2-5 |
| Lithium segment | $1,620M | $2,342M | +45% -3-8 |
| Lithium share | ~62% | ~70% (estimated) | +8 percentage points |
8.2 Key Trends to Watch
1. Continued Lithium Penetration
Lithium will continue displacing lead-acid across all segments as prices decline and performance improves. By 2032, lithium is expected to represent 70%+ of market value -3-6.
2. Technology Advancements
-
Higher energy density: More range in same form factor
-
Faster charging: 1–2 hour full charges becoming standard
-
Improved BMS: Smarter, more communicative systems
-
Integrated heating: Self-warming batteries for cold climates
3. Supply Chain Evolution
Manufacturers will increasingly regionalize production to mitigate tariff risks and reduce lead times. China will remain the dominant producer, but assembly operations will expand in North America and Europe -2-5.
4. Sustainability Focus
-
Recyclability improvements for end-of-life batteries
-
Second-life applications repurposing cart batteries for stationary storage
-
Circular economy models gaining traction
5. Aftermarket Expansion
The replacement and upgrade market will grow faster than OEM as existing carts convert to lithium. DIY installation and online sales will increase -6-7.
8.3 Potential Challenges
-
Raw material price volatility affecting battery costs
-
Regulatory changes impacting trade and manufacturing
-
Technology disruption from alternative chemistries
-
Economic cycles affecting discretionary spending
Part 9: Implications for Stakeholders
9.1 For Golf Cart Owners
-
Early adopters benefit from years of lithium performance
-
Wait-and-see buyers will find more options and lower prices
-
Fleet operators should model total cost of ownership, not upfront price
Actionable Advice:
-
Calculate your ROI timeline based on usage frequency
-
Consider total cost, not just purchase price
-
Verify compatibility before purchasing
-
Buy from reputable manufacturers with strong warranties
9.2 For Manufacturers
-
Lithium specialists should focus on BMS sophistication and reliability
-
Lead-acid incumbents must transition product lines or lose share
-
OEM suppliers need to integrate with cart manufacturers’ design cycles
Strategic Priorities:
-
Invest in R&D for energy density and safety
-
Develop modular, serviceable designs
-
Build regional supply chain resilience
-
Strengthen aftermarket support networks
9.3 For Distributors and Retailers
-
Expand lithium inventory as demand grows
-
Train staff on lithium technology and installation
-
Offer upgrade packages including batteries, chargers, and accessories
-
Develop installation services to capture additional value
9.4 For Investors
-
Lithium battery manufacturers offer exposure to high-growth segment
-
Lead-acid producers face structural decline absent successful transition
-
Supply chain companies (materials, components) benefit from overall growth
Conclusion: The 59% Growth Story in Context
The headline “59% growth” captures attention, but the full story is more nuanced—and equally compelling.
The golf cart battery market is projected to grow from $141 million in 2025 to $259 million by 2032, a 9.11% CAGR that represents nearly 84% total growth over the forecast period -2-5. Within this, the lithium segment—already dominant at 62% share—grows even faster as technology improves and prices decline -7.
Key Takeaways:
✓ Lithium is winning—its performance advantages and lower lifetime costs drive accelerating adoption
✓ Multiple growth drivers—electrification, tourism, urbanization, and falling prices converge to fuel expansion
✓ Regional dynamics differ—North America leads, Asia-Pacific grows fastest, Europe focuses on sustainability
✓ Challenges remain—upfront costs, cold-weather limitations, and supply chain complexity require attention
✓ Future bright—technology advances, falling prices, and expanding applications will sustain growth through 2032 and beyond
For golf cart owners, the message is clear: lithium technology has matured into a compelling value proposition that delivers superior performance and lower long-term costs. For industry stakeholders, understanding these trends is essential for strategic positioning in a rapidly evolving market.
The 59% growth figure may be a simplification, but the underlying trend it represents—a fundamental transformation in how golf carts are powered—is very real. As battery technology continues to advance and costs decline, the shift to lithium will only accelerate, delivering cleaner, more efficient, and more enjoyable golf cart experiences for users worldwide.
About this analysis: Market data compiled from 360iResearch, QYResearch, Allied Market Research, and industry sources. Forecasts represent consensus views as of 2026.
Looking for quality lithium golf cart batteries? Contact our team for expert guidance on selecting the right battery for your specific needs and budget.